Undeniably one of the best cities on the planet to live, Sydney ranked third after only Vienna and Melbourne in the 2019 Global Liveability Index, published annually by The Economist. With a liveability score of 98.1 our healthcare, education and infrastructure achieved perfect scores (100) with world-class scores for Culture and Environment (97.2) and Stability (95).
That said there’s many different places to live within the Greater Sydney region, ranging from high-density inner-city high rises to mountain and rural homes. So where, within an area of 12,368.2sq km do the 5,312,163 residents of Sydney choose to live?
In this article, we share the 2019 Estimated Resident Population (ERP) data for both the largest and fastest-growing ‘Sydney suburbs’. These Statistical Area Level 2 (SA2) populations are regularly updated post-census (9 August 2016) by adding to the preceeding reported data the following components of population change.
- Natural increase (births minus deaths)
- Net internal migration (moves between and within the states) and
- Net overseas migration
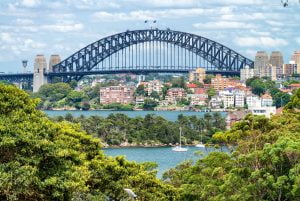

5 Largest Growth Suburbs in Sydney & NSW 2019
The size of population growth is measured in real terms as the total increase or decrease of people resident in an area for six months or more, in a year. The top five largest growth suburbs as at 30 June 2019 for NSW are all within the Greater Sydney Region. In order from largest:
- Cobbitty – Leppington
- Riverstone – Marsden Park
- Rouse Hill – Beaumont Hills
- Waterloo – Beaconsfield
- Homebush Bay – Silverwater
5 Fastest Growing Suburbs in Sydney & NSW 2019
The speed at which a suburb is growing is measured as a percentage of change year-on-year making the five fastest-growing Sydney and NSW suburbs as at 30 June 2019:
- Riverstone – Marsden Park
- Cobbitty – Leppington
- Rouse Hill – Beaumont Hills
- Chullora
- North Ryde – East Ryde
As you will see, smaller areas like Chullora may experience rapid growth (12.3%) despite relatively low growth in the real number of residents (178). This is because 100 new people in a suburb of 1000 is a 10% increase, whereas in a suburb of 10,000 people the same number represents only a 1% rate of change.
It may seem then that it would be easy for less populated areas to measure the fastest rate of increase, yet this too is dependent (amongst other things) on the amount of space actually available for people to move to – factors we discuss as we address the components of the population , and population density for each of the above-listed areas.
Due to crossover between the top five largest and fastest growth areas the combined lists represents seven areas within the Greater Sydney Region of NSW and so we have ordered the combined “largest and fastest” listed in order of largest to smallest, based on size of real population increase (ERP) as at 30 June 2019.
1. Cobbitty-Leppington
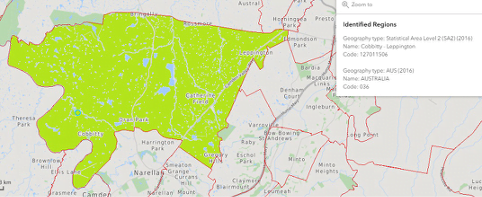
With 32,151 residents, the Cobbitty-Leppington area in Sydney’s South West region recorded the #1 largest population increase in NSW with 5280 new residents and the second-fastest rate of growth at 19.6%. With the largest geographical size on our list, encompassing more than 132km2. it also has the lowest population density at 243.3 persons per km2. In terms of the components of population change the majority (83.9%) of the population increase is attributed to internal migration (4435), followed by natural increase (766 ) and overseas migration (79).

2. Riverstone-Marsden Park
With 31,864 residents, the Riverstone – Marsden Park area in Sydney’s Blacktown region reported an additional 5275 new residents to rank as second largest growth area in NSW with the states #1 fastest growth rate (19.8%). Encompassing 79.3km2 and with a population density of 401.2 persons per km2 the area’s large majority (84.0%) of population increase is attributed to internal migration (4433), followed by natural increase (757 ) and overseas migration (185).
3. Rouse Hill – Beaumont Hills
With 31,681 residents, the Rouse Hill – Beaumont Hills area in Sydney’s Baulkham Hills and Hawkesbury region ranks third in terms of both size (3878) and speed (13.9%) of population growth. Encompassing 36.7km2 and with a population density (863.9) more than twice that of Riverstone-Marsden Park the area’s large majority (86.0%) of population increase is attributed to internal migration (3335) followed by natural increase (349 ) and overseas migration (194).
4. Waterloo – Beaconsfield
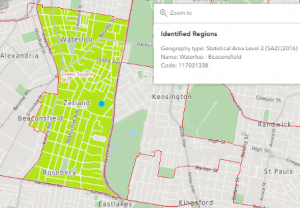
With 42,605 residents the Waterloo – Beaconsfield has the largest (ERP) in NSW. With the majority of Sydney’s Inner City residents living in high-rise apartments, Waterloo – Beaconsfield (encompassing a tiny 3.6 km2) has the highest population density on our list at 11,897.8 persons per km2 and the sixth-highest density in NSW. With an additional 2,385 estimated residents Waterloo – Beaconsfield ranks fourth in terms of size of population growth and with a 5.9% rate of growth, ranks ninth in terms of Sydney’s fastest-growing suburbs. Population growth components are internal migration (1073) and natural increase (433) while in comparison to others on our list, overseas migration (879) accounts for a considerably higher proportion of ERP at 36.9%.

5. HomeBush Bay – Silverwater
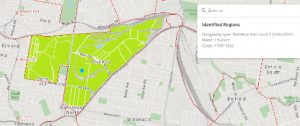
With 24,687 residents, Homebush Bay – Silverwater in Sydney’s Parramatta region ranks fifth in terms of size (1688) and sixth in terms of speed (7.3%) of population growth. Encompassing 11.3 km2 and with a population density of 2192.1 persons per km2 the area’s components of population are internal migration (958) followed by natural increase (407 ) and overseas migration (323).
6. Chullora
With only 1629 residents, Chullora, located in the Bankstown area of Sydney’s Inner South West, has the smallest population on our list. Although they record only an estimated 178 new residents on a small population base this equates to a 12.3% growth year-on-year which ranks Chullora as the fourth-fastest growing suburb in the Greater Sydney Region. Although encompassing only 4.1km2., the population density of 402.2 persons per km2. rivals Riverstone-Marsden Park an area almost twenty times the geographic size of Chullora. In terms of the components of population change the majority (70%) of the population increase is attributed to internal migration (125), followed by natural increase (34) and overseas migration (19).

7. North Ryde – East Ryde
With 14,153 residents, North Ryde – East Ryde, ranks fifth-fastest (7.4%) for NSW population growth due to an additional 979 residents. Encompassing 6.2 km2 and with a population density of 2274.2 persons per km2 the area’s components of population are internal migration (746) followed by natural increase (91) and overseas migration (142).
Thinking of Moving Sydney, NSW or Interstate?
If you’re thinking of moving locally, within the region or interstate the professional removalist team at Southside Removals can ensure a stress-free move. For over 30 years our family-owned operations have helped people move residential and commercial properties, with our services covering everything from packing and unpacking to storage and transport. Call today to learn more about our services.
